

Key Takeaways
Supply Chain Anatomy
The anatomy of a supply chain refers to the structured layers (tiers), physical or organizational locations (nodes), and the three types of flows - goods, money, and information - that move between them. Every product a business sells has traveled through this network before reaching the customer. Understanding this structure helps professionals identify where disruptions originate, where costs accumulate, and where efficiency can be gained.
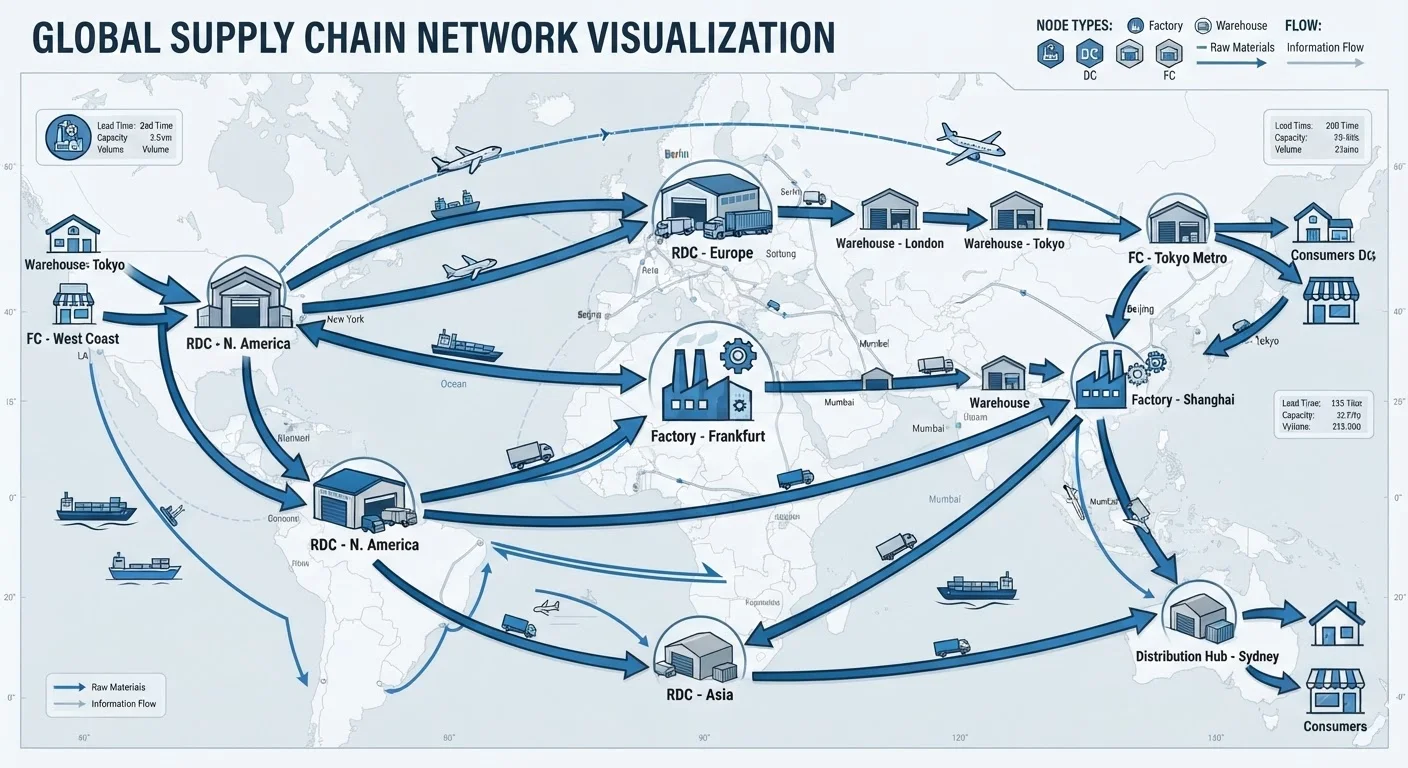
In formal supply chain literature, the network is often modeled as a directed graph where nodes represent entities (suppliers, manufacturers, distributors) and edges represent flows with associated lead times, costs, and capacities.
Tiers: Mapping Upstream Distance
Every supply chain begins long before a product reaches a shelf or a dock. Raw materials must be extracted, refined, and converted into components before any manufacturer touches them. The tier system is the framework used to describe this upstream distance.
Tier 1 suppliers have a direct contractual relationship with your business - they deliver parts, materials, or services you use immediately. Tier 2 suppliers supply your Tier 1 partners, and Tier 3 suppliers sit one layer further back. A vehicle manufacturer's Tier 1 supplier might deliver finished seats; that seat maker's Tier 2 supplier provides foam; the chemical company producing the foam's raw compounds is Tier 3.
Most organizations have strong visibility into Tier 1 - and sharply declining visibility beyond it. This gap is where risk concentrates. Regulatory pressures and resilience goals are pushing more businesses to map further upstream. For a practical framework on beginning that process, see mapping your supply chain for the first time.
~80%
Supply chain risk originating below Tier 1
Industry analyses consistently find that the majority of supply disruptions trace to Tier 2 or deeper suppliers, where most buyers lack direct oversight.
53%
Of total product cost attributable to supply chain
Research across manufacturing sectors suggests logistics and supply chain costs frequently represent more than half of a product's total landed cost.
Last mile
Accounts for up to 53% of total shipping cost
According to logistics industry research, the final delivery leg - the last node transition - is the single most expensive segment relative to distance traveled.
Nodes: Where Value Is Added or Lost
If tiers describe who is in a supply chain, nodes describe where activity happens. A node is any physical or organizational point where goods are received, handled, stored, transformed, or dispatched.
Common node types include:
- Raw material extraction sites - mines, farms, wells
- Processing facilities - mills, refineries, assembly plants
- Manufacturing plants - where components become finished goods
- Distribution centers (DCs) - regional hubs for sorting and consolidation
- Fulfillment centers - order-level picking and packing for e-commerce
- Retail outlets or end-customer locations - the final destination
Each node introduces dwell time - the period goods spend stationary. Dwell time is not inherently wasteful; strategic inventory positioning at the right node can buffer demand volatility. But unnecessary dwell inflates working capital and erodes freshness for perishable goods. Understanding how warehousing and transportation systems connect these nodes is fundamental to evaluating where inefficiency lives.
The Three Flows: Material, Financial, and Information
Goods moving through tiers and nodes are only one dimension of supply chain activity. A functioning supply chain operates three simultaneous flows, and weakness in any one constrains the others.
Material Flow
This is the physical movement of goods - raw materials going into production, components arriving at assembly, finished products shipping to distribution centers, and ultimately reaching customers. Material flow is directional: it moves forward.
Financial Flow
Payments, credits, consignment terms, and invoices travel in the opposite direction - from buyers back toward suppliers. Payment terms directly affect cash conversion cycles across the chain. A retailer offering 90-day payment terms pushes working capital burden onto its suppliers, which can stress smaller Tier 2 and Tier 3 operators.
Information Flow
Data is the flow that enables the other two. Demand forecasts and purchase orders travel upstream; shipping confirmations, production schedules, and quality certifications travel downstream. Poor information flow is frequently the root cause of the bullwhip effect - where small demand fluctuations at retail level amplify into large, disruptive swings in upstream orders. For a deeper reference on this and related concepts, the supply chain glossary is a useful companion.
“You can't manage what you can't see. The first obligation of supply chain leadership is visibility - across tiers, across nodes, and across all three flows simultaneously.”
— Supply Chain Management Review Editorial Board, Industry publication covering global supply chain strategy and operations
Why Structure Matters for Operational Decisions
Understanding supply chain anatomy is not academic - it directly informs decisions about sourcing strategy, inventory positioning, risk mitigation, and technology investment. A business that knows its Tier 2 exposure can pre-qualify alternative suppliers before disruption strikes. One that understands node dwell times can identify where to reduce inventory without degrading service levels.
The structure also frames conversations with logistics partners. Logistics operations professionals - whether internal teams or third-party providers - use the same tier-and-node framework to design networks, set service-level expectations, and price freight contracts. Speaking this language enables more productive partnerships.
For professionals building foundational knowledge, supply chain management fundamentals and supply chain thinking principles provide the conceptual scaffolding that makes structural analysis actionable.
Start With Tier 1, Then Look Deeper
If your organization is new to supply chain mapping, begin by fully documenting your Tier 1 supplier relationships - locations, capacities, dependencies, and financial stability. Once that picture is clear, identify which Tier 1 suppliers carry the highest single-source risk and prioritize mapping their own upstream inputs. Even partial Tier 2 visibility significantly improves your risk posture.
This article is for informational and educational purposes only. It does not constitute professional supply chain, financial, or legal advice. Consult qualified advisers for decisions specific to your organization's circumstances.